













Background Color:#FDEEF2
Icon Color: #CF2D5F
Day: 05e73a7a-1dc2-444e-a32a-7e07d10ced47
Week: Advanced Custom Field
Month: 05e73a7a-1dc2-444e-a32a-7e07d10ced47
Quarter: 05e73a7a-1dc2-444e-a32a-7e07d10ced47
Year: 05e73a7a-1dc2-444e-a32a-7e07d10ced47
Day vs Day: 05e73a7a-1dc2-444e-a32a-7e07d10ced47
Week vs Week: 05e73a7a-1dc2-444e-a32a-7e07d10ced47
Month vs Month: 05e73a7a-1dc2-444e-a32a-7e07d10ced47
Quarter vs Quarter: 05e73a7a-1dc2-444e-a32a-7e07d10ced47
Year vs Year: 05e73a7a-1dc2-444e-a32a-7e07d10ced47
### Who It’s For
This report is for anyone tracking inventory and purchases closely enough to care about real profit, not guesses. It’s especially helpful for bookkeepers, accountants, and operators of small-to-mid sized businesses who need to answer, “What did we actually spend to make what we sold?” without rebuilding the math in a spreadsheet. If you’re tired of margins that don’t match reality, this is the report you’ll keep coming back to. Just don’t let it scare you into skipping it.
### What It Does
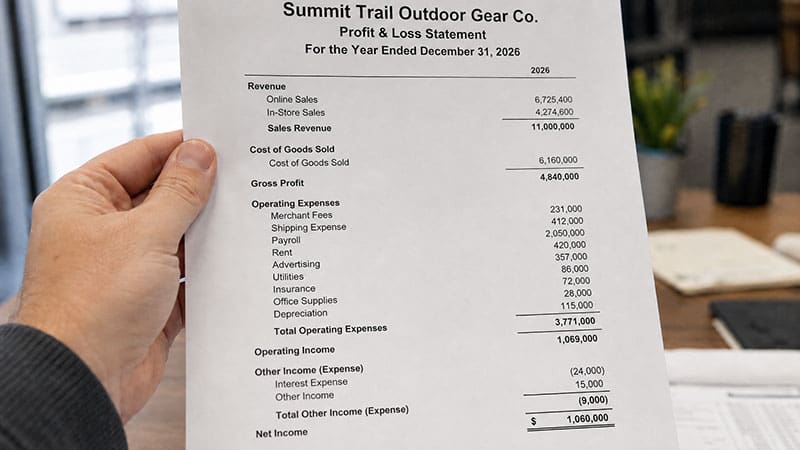
The Cost Of Goods Sold (COGS) Report calculates and summarizes what it cost you to produce or buy the items you sold during a specific period. In GlassJar, it connects your sales to the inventory side so your profit numbers don’t feel made up.
What you can learn from the report:
- How much of your sales period was “eaten” by direct product costs, not overhead
- Which products or inventory lines are driving higher COGS than you expected
- Whether COGS is tracking consistently month to month, or jumping without a clear reason
- Where timing issues might be showing up (like sales landing in one period while inventory movements land in another)
- What to review if profit margins look off after stock purchases, returns, or adjustments
- How changes in buying cost flow through to current COGS so you can see the impact quickly
### Use Cases
1. Monthly Close When Margins Look Wrong
A bookkeeper runs the report right before sending the monthly numbers to management. The sales totals look fine, but the gross margin dropped sharply. The COGS Report shows the period’s COGS spiked because certain inventory items were sold while purchase costs were higher than the prior month. Instead of hunting through dozens of unrelated transactions, they review the specific items and confirm the purchase timing and inventory movements, then fix what’s needed before the books are finalized.
2. Pricing Review After a Supplier Price Increase
A small retailer negotiates a higher purchase price with a supplier and wants to know how that change actually hits the bottom line. After the first month with the updated costs, they compare the COGS numbers for the affected items against prior periods. If those items are selling steadily, the report makes it obvious whether the increased supplier cost is compressing margins more than expected, so they can decide whether to adjust pricing, reorder quantities, or replace slow-moving stock.
3. Catching Inventory Timing Issues After Stock Adjustments
A team adjusts inventory after a count discrepancy. Sales are recorded normally throughout the month, but management notices the margin doesn’t line up with their expectations. The COGS Report highlights a mismatch between what was sold and what inventory suggests should have been costed in that period. They identify that the stock adjustment effectively changed the cost basis and that the period impact wasn’t what they assumed. Once corrected, future reports stop doing the weird thing again, not because anyone guessed better, but because the inventory side is aligned.
4. Tracking Returns And Their Effect On Direct Cost
When returns start piling up, you don’t just lose revenue. You may also change COGS. A business owner uses the report during a return-heavy month to see how returned items affect direct costs for the period. By isolating the period impact, they can tell whether returns are mainly reducing sales, reducing COGS, or both. It helps them explain margin swings clearly to their accountant and avoid the “I think it’s fine” approach that always turns into extra work later, a bit too ovious.