









The report library
GlassJar has a library of accounting reports. Unlike most accounting software, it does not put every report on your dashboard. You choose which reports appear there, so your dashboard shows what you track and nothing else. Each user can choose their own set.
Adding a report to your dashboard
Pick a report from the library and choose its default date range. You can choose:
- a day, week, month, quarter or year
- a comparison, such as month vs month or year vs year
You can change the range whenever you open the report.
Core financial reports
Most businesses start with three:
- the profit and loss statement, which shows income and expenses over a period
- the balance sheet, which shows what you own and owe on a date
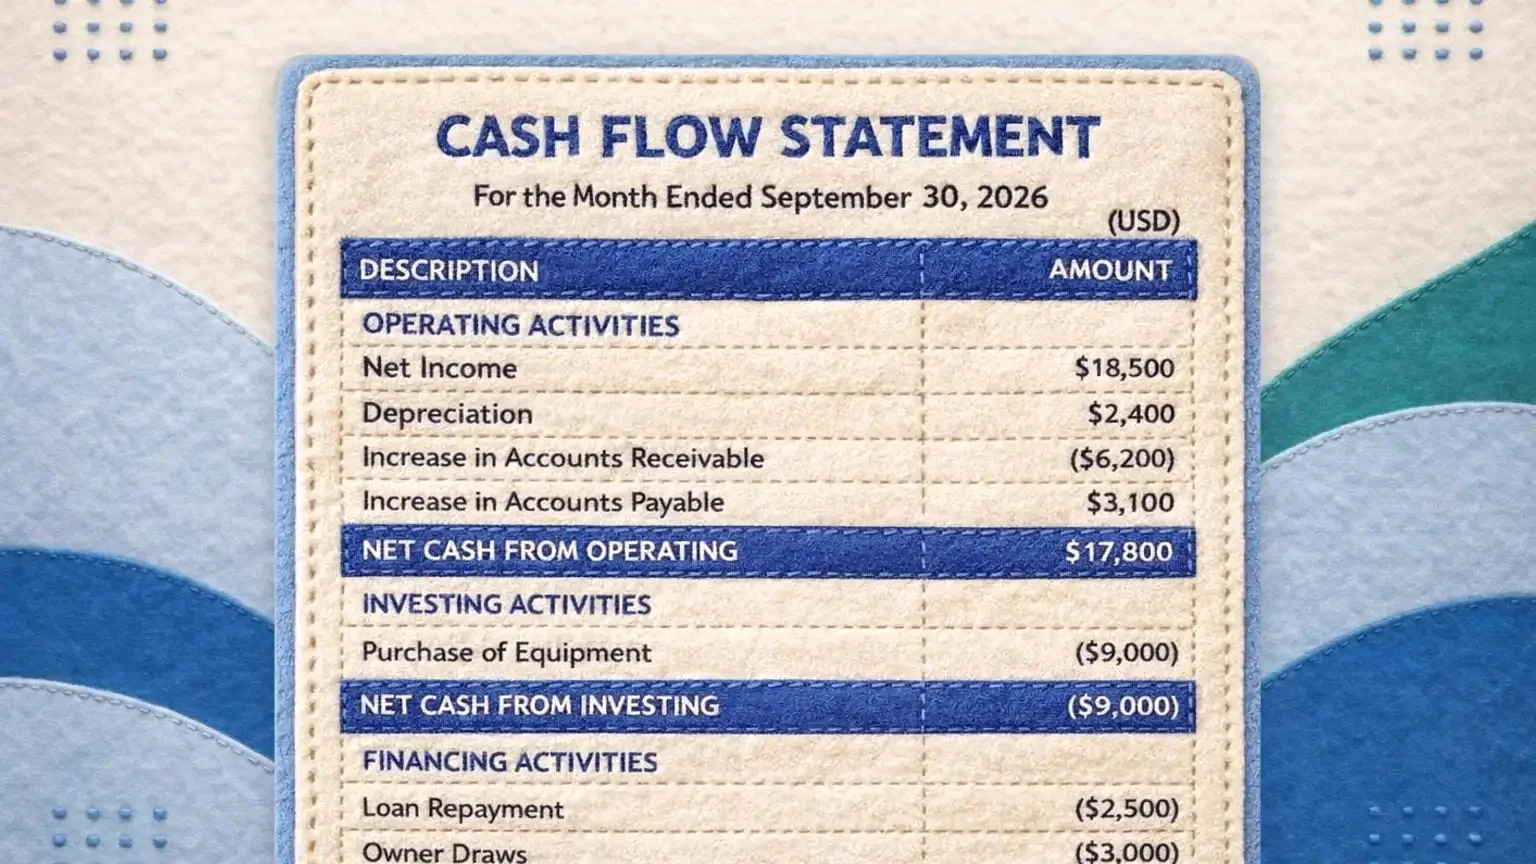
- the cash flow statement
Your accountant will usually ask for these first.
Comparing periods
Comparison ranges show two periods side by side, for example this quarter against the same quarter last year. That makes changes easy to spot.
Sharing reports with your accountant
Instead of exporting and emailing reports, invite your CPA or bookkeeper with the free seat included on every plan. They can run the reports they need themselves.