













Every business, whatever its size or industry, needs an organized way to keep track of the money moving through it. The chart of accounts (COA) is the backbone of that system, giving you a structured view of every financial corner of your operations. For small business owners, knowing what a chart of accounts is and how to set one up can lead to smarter financial decisions, cleaner records, and a much easier tax season.
This guide explains the concept, why it matters, and how to build and manage your own. Whether you’re launching a new company or cleaning up an existing setup, you’ll find best practices here that help you avoid the most common chart of accounts mistakes.
Key Takeaways
- A chart of accounts categorizes every dollar coming in or going out, so nothing gets lost or miscategorized in your financial reports.
- Start with five primary categories, assets, liabilities, equity, revenue, and expenses, then break each into sub-accounts that fit your business.
- Customize accounts to your industry, such as separate accounts for subcontractor payments and equipment rental at a construction company.
- Give each account a descriptive name like Office Equipment Purchases instead of Miscellaneous Expenses, and avoid overlapping or redundant accounts.
- The quality of your income statement, balance sheet, and cash flow reports depends directly on how your accounts are classified.
Why is the Chart of Accounts Important for Small Businesses?

A well-organized chart of accounts is critical for businesses that want accurate, transparent, and reliable financial records. Without a logical and clean COA structure, your financial reports can quickly become confusing, inconsistent, and incomplete.
Financial Accuracy and Tracking
The chart of accounts functions as a map of all of the financial transactions of a business, and every dollar that comes into the business or goes out of the business is assigned to a category in the chart of accounts so that no transaction is lost or recorded in the wrong place. When the chart of accounts is maintained accurately, expenses are easier to trace, bank accounts are easier to reconcile, and the owner of the business can see more clearly where the money of the business is being spent.
Office supplies, software subscriptions and payroll, for example, are recorded in separate expense accounts so that each category of spending can be managed on its own terms. Over time, the precision of separate expense accounts supports better informed business decisions and more reliable budgeting.
Compliance With Accounting Standards
When a business is subject to an audit or to a financial review, a standardized chart of accounts demonstrates that the business follows accepted accounting principles. A standardized chart of accounts reflects the level of preparation and organization that regulators and investors expect from a business, and standardized account categories also allow tax filings to be completed without delay and without the misclassification of transactions.
Easier to Analyze Financial Data
A well-structured chart of accounts allows financial data to be broken down by department or by project, so that the performance of an individual department or an individual project can be assessed. Marketing spending for the previous quarter, for example, can be pulled from the accounting system in a few clicks when the chart of accounts separates marketing expenses clearly from other expenses.
Analytics and forecasting are considerably more reliable when the financial structure of the business is segmented properly in the chart of accounts. Trends can be tracked, benchmarks can be set, and growth can be measured with more confidence when the underlying accounts are organized in a consistent way.
Accurate Financial Reporting
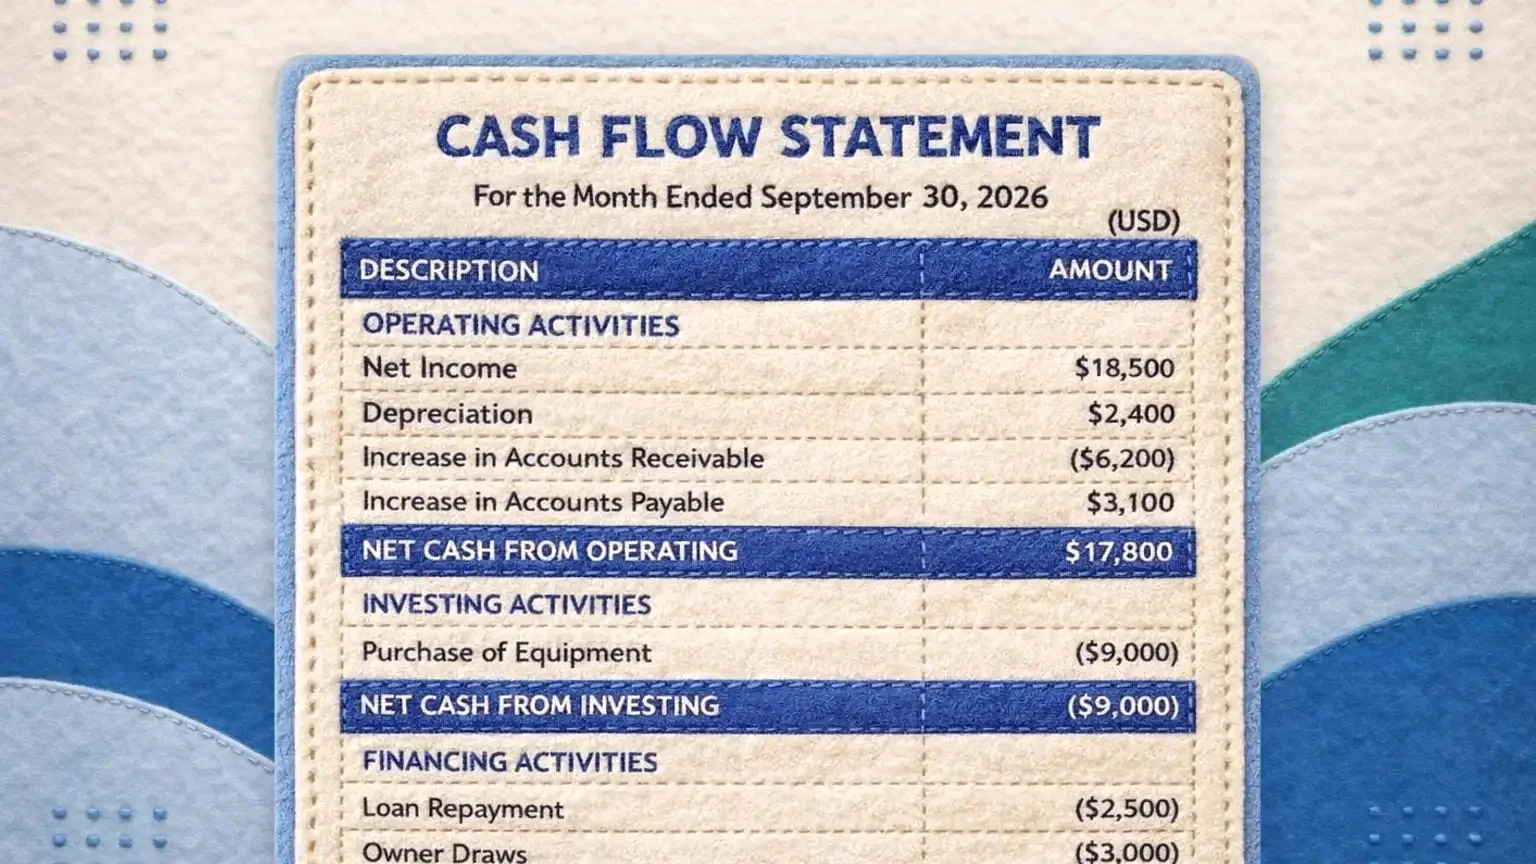
The quality of the income statement, the balance sheet and the cash flow report depends directly on how the accounts in the chart of accounts are classified. A disorganized chart of accounts produces inaccurate reports, while a streamlined chart of accounts makes the preparation of reports straightforward. Lenders, investors and business partners often judge the financial health of a business on the basis of these reports, and clean account data builds credibility with lenders and investors and can improve access to funding or credit.
How to Set Up a Chart of Accounts for Your Business

Creating a chart of accounts begins with understanding the different types of accounts your business needs. The goal is to list all of your accounts in a way that mirrors how your business functions financially.
A basic chart of accounts is divided into five primary categories of accounts, which are listed below.
- Assets are the things your business owns (e.g., cash, inventory, equipment).
- Liabilities are debts and obligations (e.g., loans, credit card balances).
- Equity is the owner’s interest in the business (e.g., retained earnings, owner contributions).
- Revenue is income from sales or services.
- Expenses are operational costs (e.g., rent, advertising, payroll).
Each of the five primary categories can be divided further into specific sub-accounts that reflect the particular needs of the business, and the number of sub-accounts depends on how much detail the business requires in its reports.
The table below shows a simplified chart of accounts example for a service-based business, with an account number, an account name and an account type for each account.
| Account Number | Account Name | Type |
|---|---|---|
| 1000 | Cash | Asset |
| 1010 | Accounts Receivable | Asset |
| 2000 | Accounts Payable | Liability |
| 2100 | Credit Card Payable | Liability |
| 3000 | Owner’s Equity | Equity |
| 4000 | Service Income | Revenue |
| 5000 | Advertising Expense | Expense |
| 5100 | Rent Expense | Expense |
| 5200 | Software Subscriptions | Expense |
| 5300 | Wages and Salaries | Expense |
The chart of accounts can also be customized to suit the industry in which the business operates. A construction company, for example, might keep separate accounts for subcontractor payments and for equipment rental, while a retail business might include accounts for inventory shrinkage and for merchant fees.
The list of accounts can be expanded or refined as the business changes over time, but the goal of every change to the chart of accounts should remain clarity and consistency in the way transactions are recorded.
Best Practices When Handling Your Business’s Chart of Accounts
Setting up the chart of accounts is not a task that is completed once and then forgotten, because the chart of accounts requires regular oversight and planning as the business changes. The practices described in the sections below are among the most important practices for maintaining a chart of accounts over time.
Clear Descriptions to Smooth the Process
Each account in the chart of accounts should include a description that explains which kinds of transactions belong in that account. A vague label such as “Miscellaneous Expenses” should be replaced with a more descriptive account name such as “Office Equipment Purchases,” because a descriptive account name reduces confusion when data is entered and when reports are reviewed.
Overlapping categories and redundant accounts should be avoided. When it is unclear whether a new account is needed, the existing accounts should be reviewed first to determine whether an existing account can be adjusted or reused for the new type of transaction.
Don’t Delete Accounts Until End of Year
Unused or outdated accounts are often deleted as the needs of the business change, but deleting an account in the middle of the year can disrupt historical data and cause errors in financial reporting. Accounts that are no longer needed should be marked as inactive during the year, and permanent changes to the chart of accounts should wait until the end of the fiscal year so that the financial records of the business remain intact.
An account that is no longer relevant to current operations may still be needed for year-end reconciliations, for audits, or for comparisons between the current year and prior years.
Maintain a Consistent Format
The numbering system in the chart of accounts should reflect the structure of the business and should remain consistent over time. All expense accounts, for example, can be grouped in the 5000 to 5999 range, and a consistent numbering range makes the books easier to read and easier to automate with accounting software.
A consistent format in the chart of accounts also supports integration with accounting tools such as GlassJar, which often rely on standardized account formats to generate accurate dashboards and accurate financial reports.
Avoid Over-Categorizing
Customization of the chart of accounts is important, but excessive customization creates unnecessary complexity in the books. Separate accounts should not be created for every vendor or for every transaction type unless the business has a real need to track that vendor or that transaction type on its own, and the chart of accounts should be limited to categories that provide meaningful information while remaining lean and manageable.
A single “Digital Advertising” account with memo fields or tags for additional detail, for example, can be used in place of separate accounts for “Google Ads,” “Facebook Ads,” and “LinkedIn Ads.”
Schedule Routine Reviews
Time should be set aside each quarter or every six months for a review of the chart of accounts. During the review, redundant accounts are eliminated, the use of each account is verified, and the chart of accounts is checked against current business practices, so that problems are identified and corrected before the problems grow and so that the chart of accounts continues to reflect the actual financial operations of the business.
The involvement of an accountant or a bookkeeper in the review of the chart of accounts can bring expert judgment to the process and can help identify opportunities to simplify the account structure.
Map Your COA to Reporting Goals
The chart of accounts should support the financial reports on which the business relies most often. When profit and loss statements (P&Ls) are prepared regularly by department, or when monthly sales are compared by region, the structure of the chart of accounts should allow those departmental and regional reports to be produced, because proper account mapping is what turns raw transaction data into information that supports decisions.
A well-designed chart of accounts also shortens the learning period for new staff and for external accountants, and a well-designed chart of accounts improves consistency in the way transactions are recorded across the business.
Plan for Growth
The complexity of the financial operations of a business increases as the business expands, and the chart of accounts should be designed with that expansion in mind. Gaps should be left in the numbering system so that new accounts can be inserted later without disrupting the existing account structure, and the reporting needs that the business is likely to have in the future should be considered when the chart of accounts is first built.
Startups frequently build a minimal chart of accounts to get through the early period of the business and then outgrow that minimal chart of accounts within months. A modest amount of planning at the start saves a considerable amount of time and rework later.
Use Software That Supports COA Customization

Not all accounting platforms offer the same level of customization. Choose software that gives you full control over your COA setup, like GlassJar. This allows you to create new accounts, deactivate old ones, and reorganize your structure to match your business goals without disrupting the rest of your data.
Access to smart filtering, account tagging and automated account suggestions in the accounting software can further improve the workflows that depend on the chart of accounts.
Understanding Account Types and How They Impact Financial Statements
The structure of the chart of accounts directly affects the accuracy and the usefulness of the financial statements of a business. Each account is tied to a specific area of the financial activity of the business and is reflected in reports such as the balance sheet, the income statement and the cash flow statement, and an understanding of how the accounts are grouped helps ensure that financial reporting is both clear and complete.
The Role of Asset Accounts
Asset accounts represent resources that the business owns. Asset accounts can include tangible items such as cash, inventory, vehicles and equipment, as well as intangible assets such as trademarks or software licenses. In most accounting systems, asset accounts fall within the 1000 to 1999 range, and each asset account provides information about a specific category of assets and allows more detailed reporting.
Assets are commonly divided into two major categories, current assets and non-current assets. Current assets, such as checking accounts and accounts receivable, are expected to be converted to cash or used within one fiscal year. Non-current assets, which are also referred to as fixed assets, include property, plant and equipment, and non-current assets are expected to provide value to the business for more than one year.
Tracking depreciation is a key component of managing fixed assets. Depreciation accounts reflect the allocation of the cost of an asset over the useful life of the asset and reduce the net book value of assets shown on the financial statements. The accumulated depreciation account is a contra asset account, and the accumulated depreciation account appears on the balance sheet to offset the corresponding fixed asset accounts.
Understanding Liability Accounts
Liability accounts record the debts and obligations that a business owes to outside parties. Liability accounts are typically recorded in the 2000 to 2999 range of the chart of accounts, and like assets, liabilities are classified as current or long-term. Current liabilities include accounts payable, accrued expenses and short-term loans that are due within one year, while long-term liabilities may include mortgages, long-term lease obligations and other debts that are payable over multiple years.
Accounts payable is one of the most commonly used liability accounts. The accounts payable account tracks the amounts owed to vendors or suppliers for goods and services that have been received by the business but have not yet been paid for, and accurate management of accounts payable supports timely payments, good vendor relationships and the avoidance of late fees.
Accurate tracking of liability accounts is essential for preparing financial statements that reflect the obligations of the business. Liability accounts appear on the balance sheet and affect the overall assessment of the financial health of the company.
Equity Accounts and Business Ownership
Equity accounts represent the interest of the owners in the business after liabilities are subtracted from assets. Equity accounts may include retained earnings, common stock, owner’s draws and additional paid-in capital, and equity accounts are typically located in the 3000 to 3999 range of the chart of accounts.
The balance of the equity accounts changes over time on the basis of profits, losses and any distributions made to the owners of the business. Accurate tracking of the equity accounts helps determine the net worth of the business and is especially useful when the business is preparing for taxes or seeking investors. Equity accounts are also a required component of the balance sheet accounts and are needed to assess the net position of the business.
Revenue and Expense Accounts in the General Ledger
Revenue accounts and expense accounts carry the majority of the day-to-day transaction entries in the general ledger. Revenue accounts and expense accounts record the income from operations and the various costs of running the business, and the general ledger serves as the central record where all transactions are posted according to the structure of the chart of accounts.
When revenue is recognized, the revenue is posted to a corresponding income account. Common revenue accounts include product sales, service income and consulting fees, while expense accounts cover categories such as rent, utilities, wages, software and marketing. When revenue entries and expense entries are grouped properly within the general ledger, the financial reports of the business reflect the operational performance of the business accurately.
Organizing Balance Sheet Accounts Effectively

Balance sheet accounts include all assets, liabilities, and equity accounts. These accounts are permanent and carry their balances forward from one fiscal year to the next. This differs from income statement accounts, which are temporary and reset at year-end.
Proper organization of the balance sheet accounts in the chart of accounts is critical for producing timely and accurate financial statements. A properly organized structure allows accountants, auditors and other stakeholders to review key financial ratios, to assess the solvency of the business, and to evaluate the overall financial position of the business.
In the end, your financial statements are only as reliable as the chart of accounts behind them. Give each account a clear definition, keep an eye on how your accounts are being used, and you’ll avoid most misclassifications, catch errors early, and be ready for growth when it comes.